
FAQ about water test results for wells and rainwater
EPA sets the maximum contaminant level (MCL) for arsenic at 10 parts per billion (ppb) (or 0.010 parts per million).
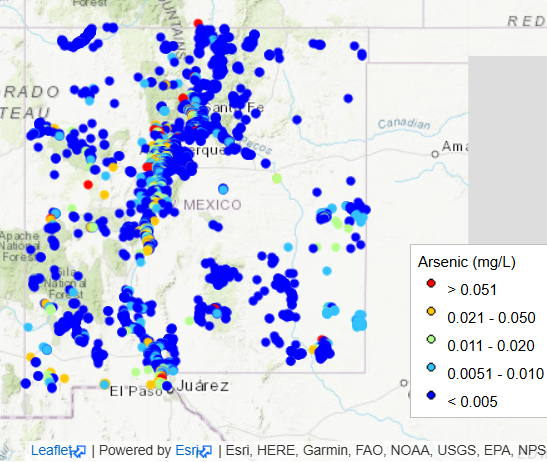
The amount of naturally occurring arsenic in drinking water in New Mexico is among the highest in the United States. Climate and soil conditions affect how much arsenic ends up in our ground water. The abundance of arsenic is typically highest in organic-rich shale and volcanic rocks, particularly in light-colored, silica-rich volcanic rocks like those in the Jemez Mountains, which can contain as much as several hundred parts per million (ppm) of arsenic.
Exposure to arsenic through drinking water can cause skin lesions, cancer, and damage to the cardiovascular and nervous systems.
Many people may not realize their water contains unsafe arsenic levels. Arsenic is tasteless, odorless, and colorless in water (at least in natural concentrations). The only way to know if water is contaminated with arsenic is to test it.
It can be hard to remove arsenic from water. Reverse Osmosis, membrane filtration, coagulation-filtration, phytoremediation (plant-based), and advanced oxidation techniques exist. Switching to alternative water sources is often the simplest solution.
Check out this map of arsenic sample points across NM: https://geoinfo.nmt.edu/hazards/arsenic/home.html
EPA allowable Limit = 1.3 PPM
Copper is a naturally occurring metal that is widely used in plumbing, faucets, and fixtures. Copper enters drinking water primarily via corrosion of copper plumbing. While copper is an essential element for human health, ingesting too much copper can have harmful effects, especially for children.
Health
At low levels, copper is an essential nutrient. Health protective levels of copper in drinking water have been established based on potential adverse effects to the gastrointestinal system, kidneys, and liver, especially for infants and children. Acute exposure to high copper levels uncommonly found in drinking water can cause nausea, vomiting, diarrhea, and stomach cramps.
Hardness is the sum of dissolved calcium and magnesium ions in water. Water that has high hardness, described as 'hard water', contains high concentrations of naturally occurring dissolved minerals. The hardness of water, usually reported in terms of calcium carbonate concentration, indicates the degree to which the water reacts with soap; hard water requires more soap to produce a lather and often deposits precipitates, or 'soap scum'. There is no official hardness scale but many labs use the following ranges, which are endorsed by the WHO:
- soft = below 60 mg/L as CaCO3
- moderately hard = 60–120 mg/L
- hard = 120–180 mg/L
- very hard = more than 180 mg/L
Common Sources
Hardness is naturally caused by minerals that dissolve into water as it passes through soil and rocks, especially in geological areas that contain sedimentary rocks like limestone and dolomite. Runoff from agricultural and industrial areas can also affect local water hardness. Groundwater is typically harder than surface water.
Health
Hardness is mostly representative of the calcium and magnesium in tap water, which are both essential minerals for your body. Because hard water dries skin and hair, there is some evidence that high levels of hardness may be a risk factor to exacerbating eczema. The association between excessive water hardness and digestive or cardiovascular diseases remains underexplored.
Plumbing
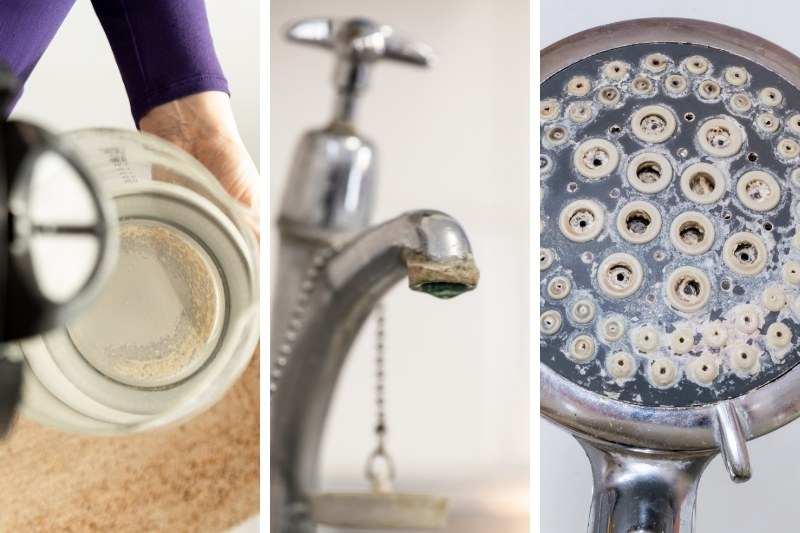
The ions that contribute to bicarbonate or temporary hardness lead to scale build up in plumbing and water-using appliances. Scale that forms within appliances, pumps, valves, and water meters causes wear on moving parts. When hard water is heated, scale forms much faster. This creates an insulation problem inside boilers, water heaters, and hot-water lines, and increases water heating costs. Excessive hardness can also cause corrosion of zinc, which is often used as a protective layer inside of galvanized pipes; this corrosion may increase concentrations of heavy metals in tap water and shorten the lifespan of appliances.
The EPA's action level is 15 parts per billion (ppb) or 0.015 PPM. This will lower to 10 ppb effective November 2027. This is the trigger for mandatory utility action, but health authorities agree there is no safe level of lead exposure, especially for children. The EPA's Maximum Contaminant Level Goal (MCLG) for lead is zero.
Lead in Drinking Water
Lead is one of the most dangerous contaminants in drinking water. Corrosion of plumbing is the largest source of lead in drinking water, including lead pipes, lead solder and brass fixtures in your home or building.
- Where present, lead service lines (also known as lead pipes) are the leading source of lead in drinking water. An estimated 6 to 10 million lead service lines are still in use by homes throughout the United States.
- Other common sources of lead in drinking water include faucets and fixtures. Homes built before 1986 are more likely to have lead plumbing.
- Lead solder (used in copper plumbing before it was banned in 1986)
- Brass fixtures may contain up to 8% lead (reduced to 0.25% after the 2014 Reduction of Lead in Drinking Water Act).
Where present, lead service lines (also known as lead pipes) are the leading source of lead in drinking water.
Health
Lead is a potent neurotoxin that accumulates in the body over time. The CDC states it can cause developmental delays in children. In adults, the EPA links it to kidney and blood pressure problems.
What level of lead in water is safe?
According to the EPA, there is no safe level of lead exposure. The EPA action level of 15 ppb triggers required actions by water utilities, but health effects can occur below this level. The EPA's MCLG (health goal) is zero. The American Academy of Pediatrics recommends that school drinking water contain less than 1 ppb.
How to Remove It
Testing your water is the only way to know your home's lead levels.
Many households with results in the 1–15 ppb range still choose to install a filter, especially with young children or pregnant women in the home. That’s a reasonable decision.
- Use an NSF 53-certified whole-house filter designed for lead removal if the lead source is before the home.
- Use NSF 53-certified under-sink RO or pitcher filter designed for lead removal for drinking water in the home.
- Run cold water for 30 seconds before drinking if water has been sitting.
- Replace pipes and fixtures.
Filters
Many households with results in the 1–15 ppb (0.001-0.015 PPM) range still choose to install a filter, especially with young children or pregnant women in the home. That’s a reasonable decision. NSF 53-certified KDF-55 filter media paired with carbon block can remove up to 99+% of dissolved lead from water through a redox reaction that converts soluble lead ions into insoluble forms that bond to the media surface.
If a filter has NSF 53 certification for lead, it has been independently verified by a third-party lab to reduce lead from a challenge concentration of 150 ppb to 5 ppb or lower under specified flow and capacity conditions. This is the minimum standard you should look for.
Most filters are not effective to remove lead levels that are already below 1 ppb.
Note that RO produces wastewater — typically 3–4 gallons discarded for every 1 gallon filtered.
Nitrate is a compound made of nitrogen and oxygen that occurs naturally in soil and water. In small amounts, it’s a normal part of the environment and part of the natural nitrogen cycle. The problem starts when nitrate concentrations climb above the EPA’s maximum contaminant level of 10 mg/L (also written as 10 ppm), especially for babies and pregnant women.
Nitrate is naturally occurring and often present in drinking water at levels that do not affect health. Nitrate can contaminate both ground and surface water, though concentrations are generally higher in well water. Sources of nitrate include agricultural runoff (chemical fertilizers and animal waste), industrial waste, sewage and septic systems, and the erosion of natural deposits.
Climate change is also shifting patterns: heavier spring rains wash more fertilizer into groundwater, and drier summers concentrate existing nitrate in shallow wells. Agricultural spray can also land on roofs, affecting rainwater.
Background Nitrate
Natural background nitrate exists too, typically below 3 mg/L. In groundwater and surface water, it comes from decaying organic matter and natural nitrogen fixation by soil bacteria. If your well water tests above that range, contamination from human activity is the most likely explanation.
Background nitrates also occur naturally in rainwater through atmospheric nitrogen fixation, catalyzed by lightning and electrification in the atmosphere. Air is composed of 78 percent nitrogen and 21 percent oxygen and these two elements become ionized and combine to form nitrate. (An important natural source of nutrients for plants.)
What to do with your Nitrate reading
Track trends and identify whether nitrate is climbing year over year.
If your home has a private well and you have an infant, our team strongly recommends testing the water before using it for formula.
Testing for Nitrate
You may also see results reported as “nitrate as nitrogen” (NO3-N) or “nitrate as nitrate.” These units are not interchangeable. To convert nitrate as N to nitrate as nitrate, multiply by 4.4. A 2 ppm “as N” reading equals about 8.8 ppm “as nitrate.” This conversion confuses many well owners, and it matters because the EPA’s 10 mg/L limit is expressed as nitrate as N.
Nitrite
Nitrite is a related but more toxic compound. It’s the form that actually causes methemoglobinemia once nitrate is reduced inside the body. The EPA limit for Nitrite as N is 1 mg/L, since nitrite is roughly ten times more potent per unit.
Silica in water is silicon dioxide (SiO2), a natural mineral that dissolves from rocks, sand, and soil into groundwater as it passes through geological formations. Most tap and well water contains some silica, ranging from a few parts per million in surface supplies to over 100 ppm in certain well water sources.
Almost every household water sample contains silica at some level.
If you rely on well water, your silica level is almost entirely a reflection of your local geology. Reservoirs fed by snowmelt that has trickled through granite valleys can show surprisingly high silica.
Health
Silica in drinking water is considered safe. The U.S. Environmental Protection Agency has not established a Maximum Contaminant Level for silica, and the World Health Organization has no health-based guideline value because available evidence shows no consistent toxicity at the concentrations found in drinking water. Even at 100 ppm, no peer-reviewed study has linked silica in water to illness in healthy adults.
Crystalline silica dust is a known inhalation hazard linked to lung disease (silicosis), but that risk does not apply to dissolved silica in drinking water.
Many premium mineral waters contain silica.
Potential benefits of silica in drinking water
- Bone health: Contributes to collagen formation and bone mineral density
- Skin, hair, and nails: Supports connective tissue strength and elasticity
- Aluminum removal: Some early research suggests it may help the body excrete aluminum, though evidence is limited
- Cognitive function: Preliminary studies are exploring silicon’s role in brain health
- Joint support: Helps maintain cartilage and connective tissue integrity
Plumbing
The bigger practical concern is not toxicity but what high silica does to your plumbing, fixtures, and appliances. Unlike calcium-based hard water scale, silica deposits often form a glass-like bond with the surface underneath. Once etched, glass cannot be restored by cleaning, which is why prevention is much cheaper than replacement.
EPA Health Reference Level (HRL) Standard <= 150 ppm
Strontium, a naturally occurring element, is found in most drinking water supplies (approximately 99% of tested water systems, usually < 7ppm). While it's not a household name like calcium or iron, its presence in our water supply has drawn attention from scientists and health experts. The relationship between strontium and calcium in water is of particular interest, as these elements share similar chemical properties.
Its levels can vary widely depending on local geology and human activities. Groundwater often contains more strontium than surface water due to prolonged contact with rock formations. Rivers and lakes may have lower concentrations, but this can change near industrial sites or areas with high natural strontium levels. Clay soils typically hold more strontium than sandy soils.
Health
Strontium in drinking water can have both positive and negative effects on human health. Its impact depends on factors like concentration levels and the type of strontium present.
Strontium and calcium have similar chemical properties. The body sometimes treats them alike. Strontium can replace calcium in bones, so strontium plays a role in bone health and development. At low levels, it may help strengthen bones. Strontium can incorporate into bone tissue, potentially increasing bone mineral density.
In children and infants, proper strontium levels support healthy skeletal development. Too much strontium, however, can interfere with calcium absorption. Too much strontium compared to calcium may disrupt bone mineralization. This is especially important for growing children. A balanced ratio of strontium to calcium is key for bone health.
The EPA’s 1,500 µg/L (150 mg/L) health reference level is based on protecting against adverse bone effects in children, the most sensitive endpoint.
For adults, some studies suggest strontium supplements could help treat osteoporosis. But high strontium intake from drinking water may have different effects than controlled supplement use.
Removal
Standard activated carbon filters (pitcher filters, refrigerator filters) do not meaningfully reduce strontium. Reverse Osmosis, Ion Exchange, Distillation, or lime softening are effective removal methods for strontium.
EPA Secondary Standard <= 250 ppm
Sulfate occurs naturally in drinking water. It occurs naturally in many water sources and can also come from industrial processes. While sulfate generally doesn’t pose major health risks, it can affect how water tastes and smells.
Health
High levels may cause temporary stomach upset or diarrhea (a laxative effect) in some people, especially in infants who are not used to it. In the U.S., the EPA lists a secondary maximum contaminant level of 250 mg/L mainly for taste and odor, and it notes that the Safe Drinking Water Act required a joint EPA/CDC study to better understand health effects.
Taste and Odor Issues
The taste of water changes when sulfate levels are above 250 mg/L. This is why the EPA set this as the Secondary Maximum Contaminant Level.
Sulfate itself does not produce odors in water, but sulfate-reducing bacteria can create hydrogen sulfide gas, which smells like rotten eggs. This gas isn’t usually harmful but can be a nuisance.
Scale
High sulfate levels in water can lead to scale buildup in pipes and appliances. This buildup reduces efficiency and increases energy use.
Indicators of Sulfate Presence
High sulfate levels in water can cause noticeable changes. A rotting egg odor is often a sign of sulfates. This smell is due to hydrogen sulfide gas, which forms when sulfate-reducing bacteria break down sulfates.
Water color may also change. Sulfates can make water appear cloudy or give it a slight yellowish tint. However, color alone isn’t a reliable indicator.
Taste is another clue. Sulfates can make water taste bitter or salty. The taste threshold varies, but most people can detect sulfates at levels above 250 mg/L.
Treatment
Several water treatment methods including carbon filters can effectively remove excess sulfate from drinking water
EPA Secondary Standard <= 500 ppm
TDS is a number you’ll see on most water quality reports, and is one of the most misunderstood measurements in drinking water. TDS (total dissolved solids) measures dissolved minerals, salts, metals, and some organic matter in water, expressed in parts per million (ppm) or milligrams per liter (mg/L). It tells you how much is dissolved, not what those substances are.
What's a "good" TDS?
TDS alone cannot determine water safety. Two water sources with the same reading may contain very different substances. The EPA lists 500 ppm as a secondary drinking water standard, primarily related to taste, appearance, and scaling—not necessarily a health-based limit. Municipal water often falls between 50 and 300 ppm, while mineral-rich well water can exceed 1,000 ppm.
WHO Classification by Taste and Palatability
Excellent: Below 300 ppm
Acceptable: 300–600 ppm
Poor: 600–900 ppm
Unacceptable: 900–1,200 ppm
Unfit: Above 1,200 ppm
What to Do with Your TDS Reading
Use TDS to track changes and monitor water treatment performance. For drinking water safety, use a certified laboratory to test for specific contaminants such as lead, nitrate, arsenic, and microbes. A TDS reading is a useful screening tool, not a safety test.
Read more about TDS in drinking water: https://www.mineralwaters.org/tds-in-drinking-water-explained/
Drinking Water <= 1 NTU
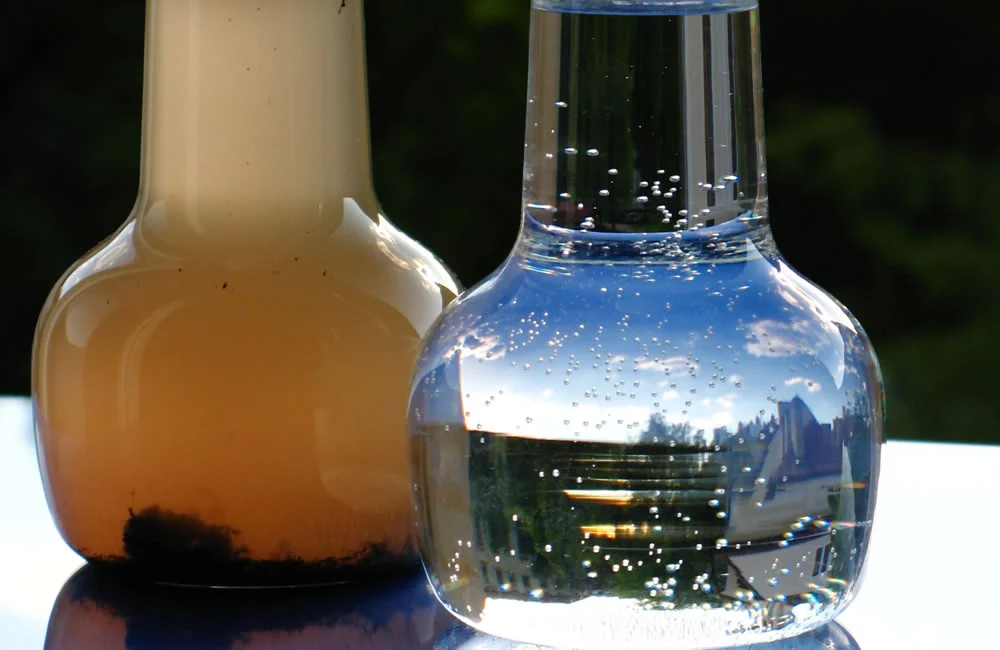
Turbidity is the measure of relative clarity/cloudiness of a liquid. It is used to indicate water quality and filtration effectiveness. It is an important indicator of water quality, as high turbidity can harbor pathogens. Higher turbidity levels are often associated with higher levels of disease-causing microorganisms such as viruses, parasites and some bacteria.
- Turbidity Measurement: Typically measured in Nephelometric Turbidity Units (NTU) using specialized sensors.
Turbidity levels are closely monitored in drinking water standards because they can indicate contamination by pathogens or chemicals.
National Primary Drinking Water Regulations (NPDWR): For systems that use conventional or direct filtration, at no time can turbidity (cloudiness of water) go higher than 1 Nephelometric Turbidity Unit (NTU), and samples for turbidity must be less than or equal to 0.3 NTUs in at least 95 percent of the samples in any month. Systems that use filtration other than the conventional or direct filtration must follow state limits, which must include turbidity at no time exceeding 5 NTUs.
The U.S. EPA sets a maximum contaminant level of 0.030 mg/L for uranium in public drinking water systems.
Uranium in Drinking Water
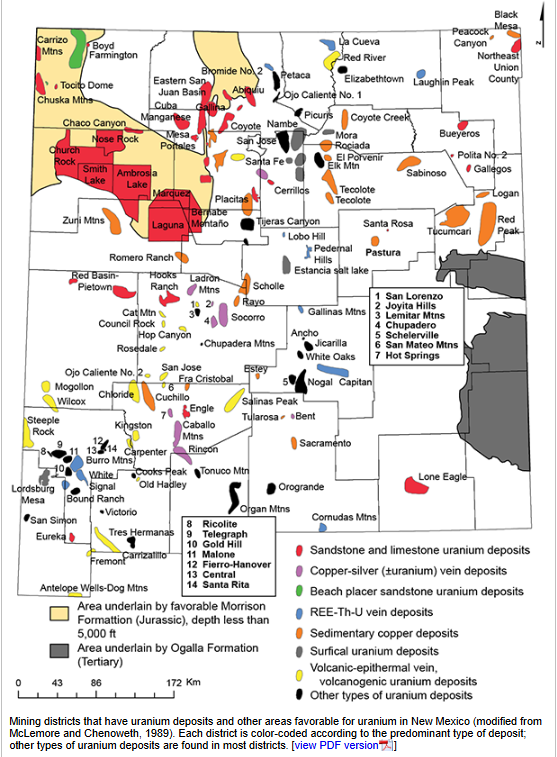
Many private wells in New Mexico contain at least trace amounts of uranium, and the typical public water tests (e.g. County) don't include it. Uranium is a naturally radioactive heavy metal found in rock and soil across much of the country. As groundwater moves through uranium-bearing rock, it can dissolve uranium and carry it into wells and aquifers — so it shows up most often in groundwater and private wells.
Health
Uranium in drinking water can accumulate in the kidneys and may cause damage over time, even at low levels. It poses a dual threat: as a heavy metal it’s chemically toxic to the kidneys, and as a radioactive element it adds a small cancer risk over a lifetime of exposure.
Risk rises with the dose and the years of exposure - daily drinking and cooking water matters most. Infants, children, and people with existing kidney problems are more vulnerable to uranium’s effects.
Signs of High Uranium Levels
You can’t see, taste, or smell uranium in water — the only way to know is to test.
What to Do About High Uranium
Uranium is removed by physically separating it from the water or by trapping it on a charged resin — not by ordinary carbon filtration. Choose a system proven to reduce uranium or radionuclides and confirm that claim on its certification. Always confirm the product is certified for uranium or radionuclide (radium 226/228) reduction.
Map
A regional geochemical (stream sediments and ground waters) and geophysical (magnetic and radiometric) database exists for the state of New Mexico.
The only way to know uranium levels in your private well is to test your water.
https://geoinfo.nmt.edu/libraries/nure/home.html
Zinc is a naturally occurring metal and an essential nutrient that supports immune function, wound healing, and enzyme activity. Adults need 8 mg daily for women and 11 mg for men, typically obtained through food.
Zinc in Drinking Water
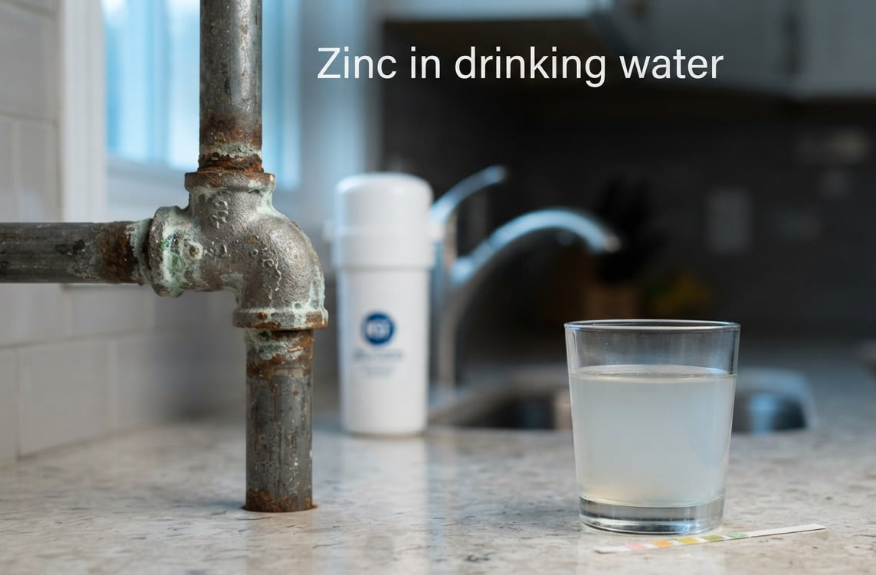
Zinc can enter drinking water from galvanized pipes, brass fixtures, and natural mineral deposits. The EPA's secondary drinking water standard is 5 mg/L (5 ppm), primarily due to taste and aesthetic concerns. Higher levels may cause gastrointestinal discomfort.
Signs of High Zinc Levels
Metallic, bitter, or astringent taste
Cloudy water or bluish-green or white stains around fixtures
Unusual residue on laundry or a greasy film after boiling
Testing is the most reliable way to confirm elevated zinc.
What to Do About High Zinc
If zinc exceeds 5 mg/L, consider an appropriately rated KDF 55 filter or an under-sink reverse osmosis (RO) system. Retest the water to verify treatment effectiveness.
Common Sources
Galvanized steel pipes can release zinc as their protective coating deteriorates, especially when water sits in the pipes overnight. Brass fixtures and water heater components may also contribute.
Test water at different faucets, both first thing in the morning and after flushing, to help determine whether the source is household plumbing or the incoming supply.
If hot water suddenly develops a metallic odor and bitter taste, a deteriorating water heater anode rod may be responsible. Contact a plumber to investigate.
Read more about Zinc in drinking water: https://www.mineralwaters.org/zinc-in-drinking-water/
Does Rainwater Have Minerals? Understanding Rainwater Composition
Rainwater mineral density is significantly lower than groundwater though it still incorporates essential trace elements like calcium and sodium.
The reality of rainwater content depends on various environmental factors.
While groundwater filters through mineral-rich rock strata for extended periods, rainwater only captures minerals during its brief descent through the atmosphere. The concentration of minerals varies based on several factors, including proximity to industrial areas, vegetation, and geography. This "atmospheric scrubbing" process results in a much lower Total Dissolved Solids (TDS) count compared to groundwater or filtered spring sources.
Common rainwater minerals:
- Calcium from soil and atmospheric dust, 1-20 mg/L
- Magnesium from soil and ocean spray, 0.5-15 mg/L
- Sodium from ocean spray and road salt, 0.3-15 mg/L
- Sulfate from industrial and volcanic particles, 2-30 mg/L
Cation Distribution (Ca, Mg, Na, K)
The positively charged ions, known as cations, are dominated by calcium and sodium. Calcium is typically sourced from the suspension of soil dust and carbonate rocks in the atmosphere. Magnesium and potassium are present in smaller, yet consistent, quantities and play a vital role in the buffering capacity of the rainwater.
These cations are essential for neutralizing the natural acidity of the rain. In areas with high dust levels, the mineral composition of rainwater may even shift toward a neutral or slightly alkaline pH due to the abundance of calcium carbonate.
Anion Profiles (Cl, SO4, NO3)
The negatively charged ions, or anions, are primarily represented by chloride, sulfate, and nitrate. Chloride is almost exclusively derived from sea salt aerosols, making it a dominant feature in coastal rainfall. Sulfates and nitrates, however, can originate from both natural volcanic activity and human industrial processes.
Even at low concentrations, these minerals provide essential electrolytes that support atmospheric chemistry and terrestrial biology. They are the building blocks of the geochemical cycle that sustains life on the surface.
These concentrations are not uniform and change based on geographical location.
Environmental Factors Altering Mineralization
Geographic proximity to oceans, deserts, or industrial centers is the primary driver of variation in rainwater's mineral profile.
Because rainwater acts as a "geochemical mirror," its geographical signature changes as the air mass moves across different terrains. A storm system moving over the Atlantic Ocean will possess a fundamentally different chemical makeup than one forming over the Great Plains or an urban industrial corridor.
Rainfall in coastal regions is characterized by a high concentration of sodium and chloride. This is due to sea spray aerosols being lofted into the atmosphere by wind. As the air mass moves further inland, these heavy marine salts "wash out," and the rain begins to pick up terrestrial minerals.
Inland or continental rain is typically richer in calcium and magnesium. This shift occurs because the rain interacts with wind-blown dust from agricultural fields, deserts, and limestone outcrops. This transition highlights how the mineral composition of rain water adapts to the local geology.
Anthropogenic vs. Natural Inputs
Human activity significantly alters the chemistry of the troposphere. In industrial regions, the rainwater may contain elevated levels of sulfates and nitrates. These inputs often come from:
- Sea spray aerosols
- Wind-blown dust
- Industrial emissions
While natural inputs like volcanic outgassing contribute to the mineral load, anthropogenic emissions from burning fossil fuels have a profound impact on the nitrogen and sulfur cycles within the rain. This can lead to increased acidity and a higher total dissolved solids (TDS) count in urban environments.
The variability of these inputs ensures that no two rain events are chemically identical. Each storm carries a unique load of minerals that reflects its specific path through the sky.
These mineral variations have a profound impact on the soil and plant life below.
Natural Nitrogen Fixation
Rainwater acts as a natural, bioavailable fertilizer by delivering dissolved nitrogen and essential trace minerals directly to the rhizosphere.
One of the most critical components of the mineral composition of rainwater to soil chemistry and plants is nitrate. During thunderstorms, lightning provides enough energy to break nitrogen bonds in the atmosphere, creating nitrogen oxides. These oxides dissolve in rain to form nitrates, a primary food source for plants.
This process, known as atmospheric nitrogen fixation, provides a steady supply of "free" fertilizer to ecosystems. It is one of the reasons why vegetation often appears significantly greener and more vibrant after a rainstorm compared to manual watering.